AI Debug & Console
AI Debug
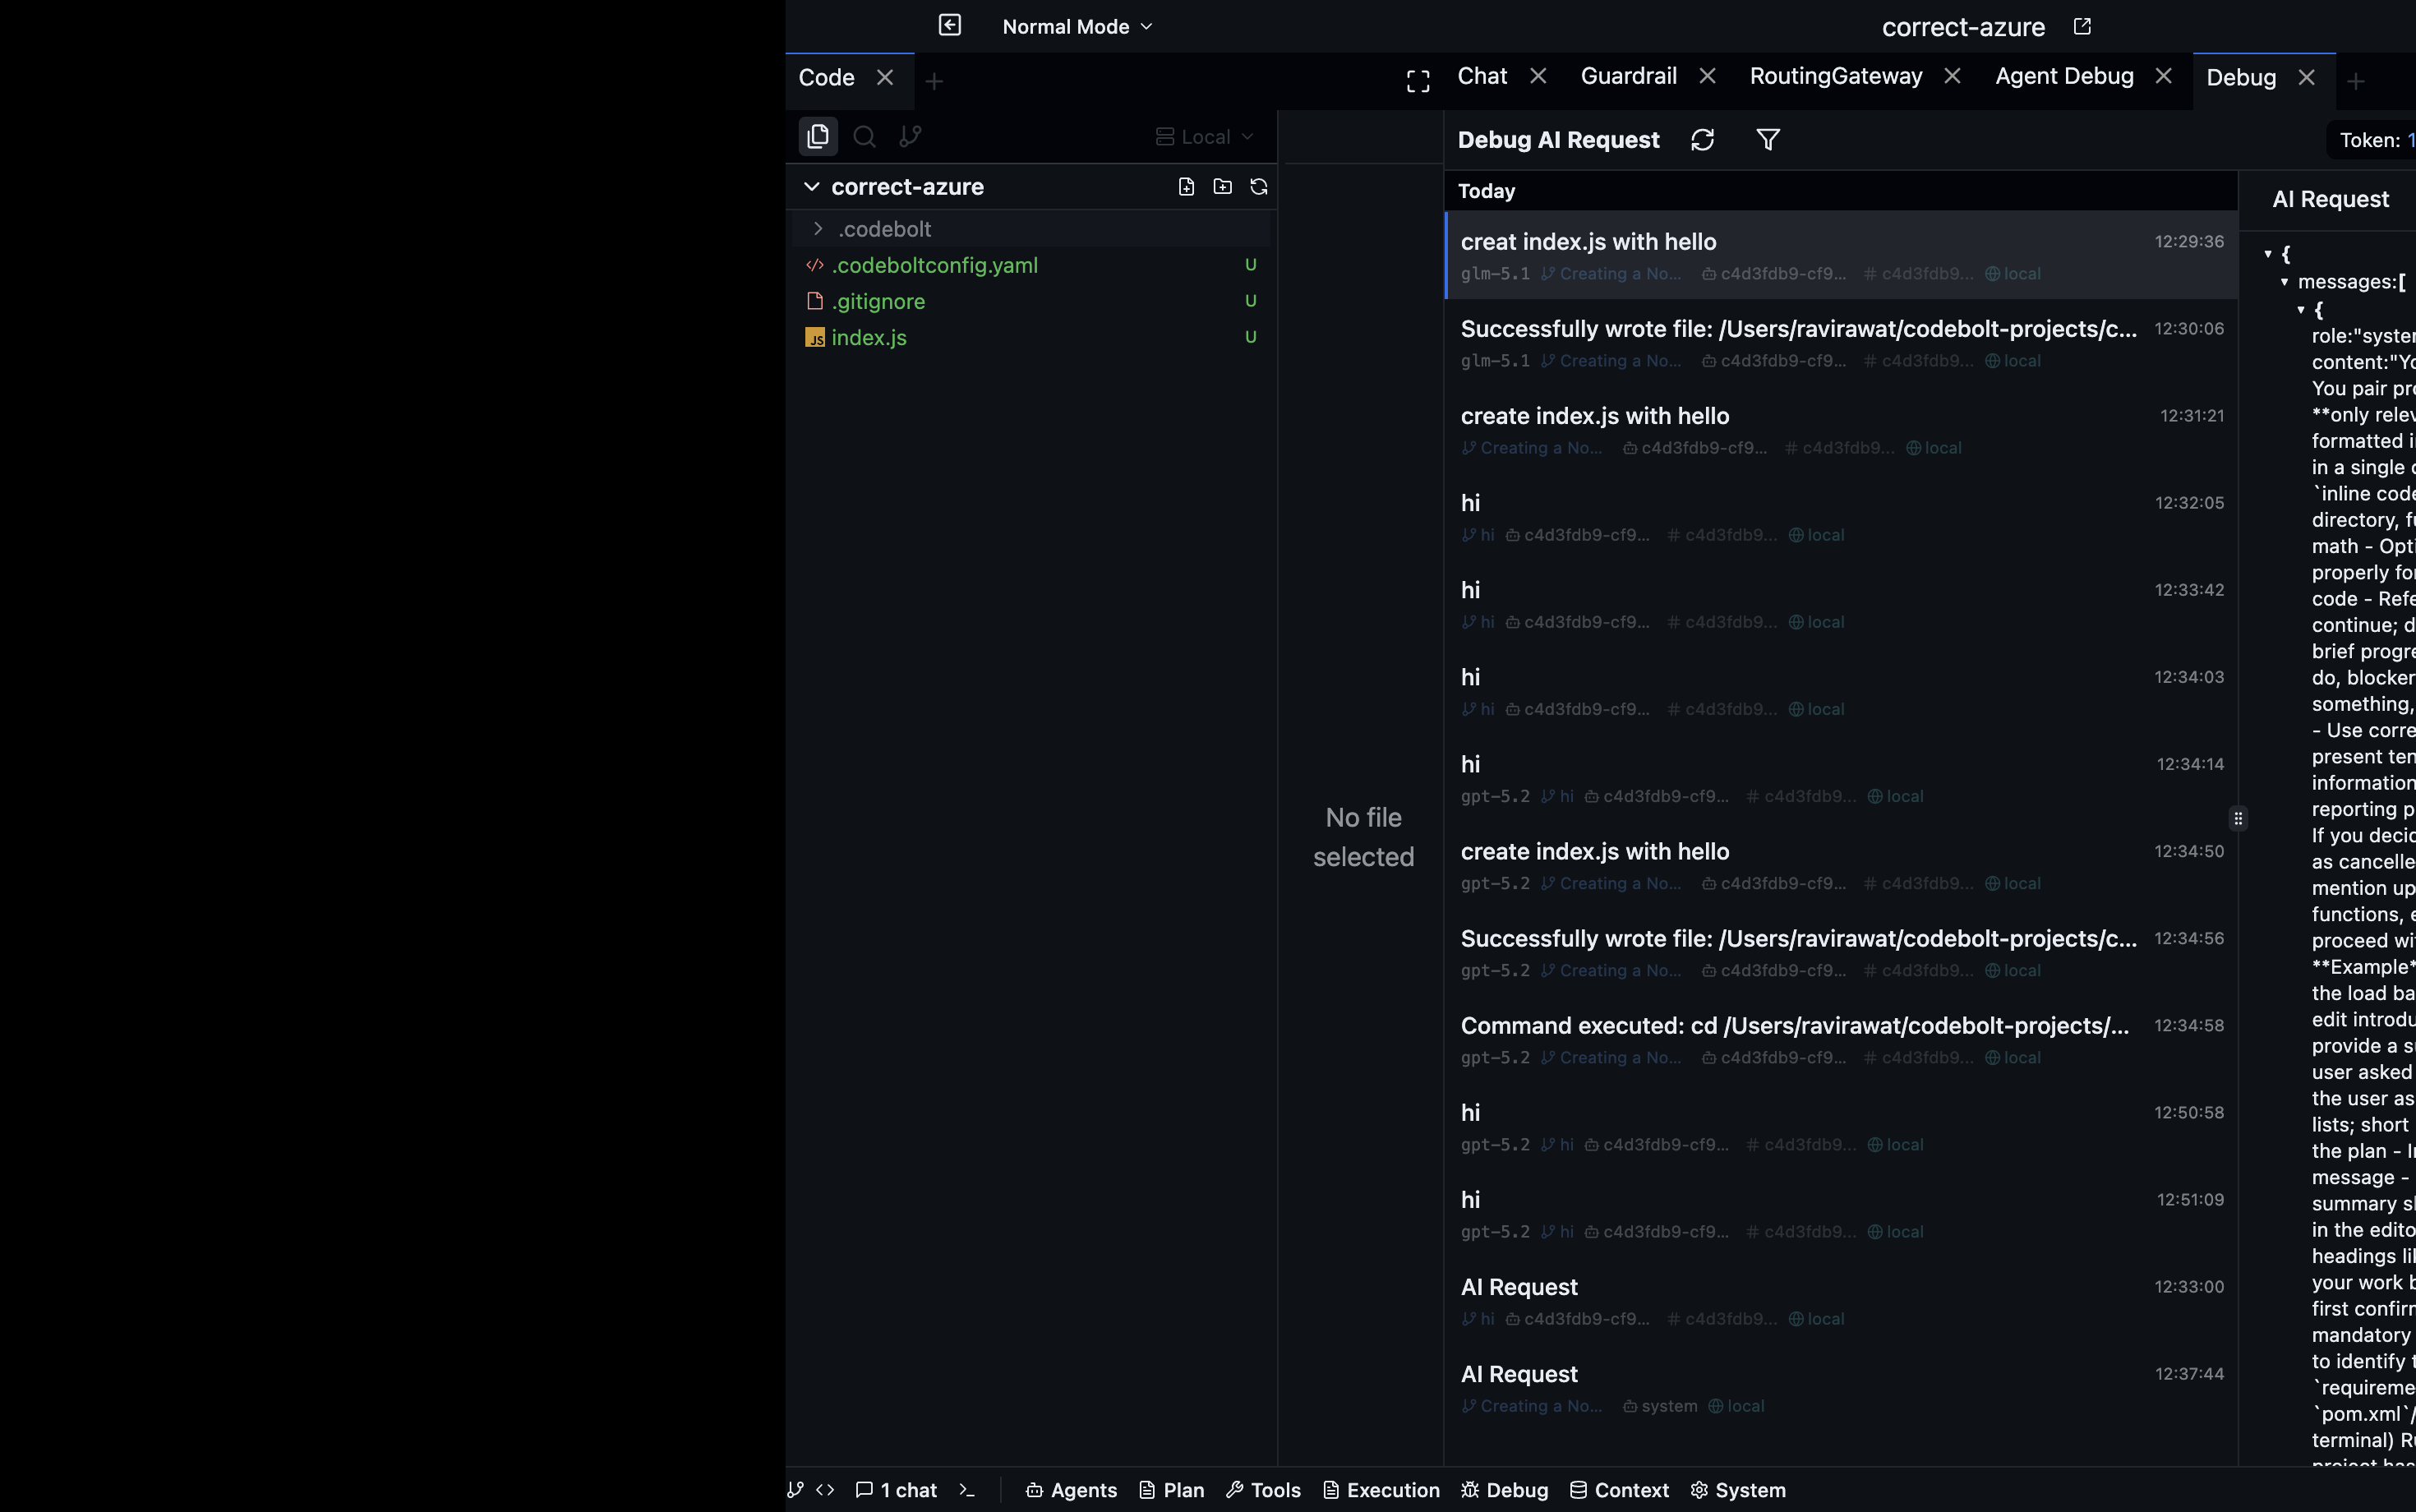
The AI Debug panel focuses specifically on LLM interactions — raw inputs, raw outputs, token counts, latency, and cost estimates. Where Agent Debug shows the full agent loop, AI Debug zooms in on just the model layer.
Open via: Debug Tools dropdown → AI Debug
What it shows
Each LLM call appears as a collapsible card:
| Field | Description |
|---|---|
| Model | The model identifier used (e.g., claude-sonnet-4-6) |
| Provider | Which LLM provider handled the call |
| Input tokens | Prompt token count |
| Output tokens | Response token count |
| Latency | Time to first token / total response time |
| Estimated cost | Calculated from the provider's published pricing |
| Request | Full prompt sent (expand to read) |
| Response | Full model reply (expand to read) |
Token budget monitoring
AI Debug shows a token budget bar for each call — how much of the model's context window was used. When a call approaches the limit, the bar turns orange (>80%) or red (>95%). Use this to identify turns where context is nearly full — often the cause of agent forgetting or truncation errors.
Comparing calls
Click Compare (top toolbar) to select two LLM calls and view them side-by-side. Useful for comparing how a prompt change affected the output, or for seeing how context grew across turns.
Export
Click Export → CSV or JSON to download all LLM calls from the current session. The export includes all fields for each call — useful for cost analysis or building a dataset from a real agent run.
Console
The Console panel captures all stdout and stderr from agent processes — the raw text your agent code writes with console.log(), print(), or any command that produces terminal output.
Open via: Debug Tools dropdown → Console
What it shows
The Console is a plain text log stream. Each line is prefixed with:
[agent-name] [timestamp] message
When multiple agents are running, their output is interleaved with different prefixes. Use the Agent filter dropdown to show only one agent's output.
Log levels
If your agent uses a structured logger, different log levels appear in different colours:
| Level | Colour |
|---|---|
DEBUG | Grey |
INFO | White |
WARN | Yellow |
ERROR | Red |
Clearing the console
Click Clear (top-right) to empty the current session's output. This doesn't affect the agent's log files on disk.
Searching
Type in the search bar to filter lines by content. The search is case-insensitive and highlights matching text.
Persisting console output
Console output for each agent run is saved to a log file on disk. The file path is shown at the bottom of the Console panel when a run completes. Open it in any text editor for offline analysis.