Agent Debug
Where you see agent logs depends on how the agent runs:
| Agent type | Where to check logs |
|---|---|
| Regular agents (started from chat or CLI) | Agent Debug Panel in the Codebolt application |
| Self-executed remote agents | Your own terminal where you started the process |
Regular agents are spawned by Codebolt's AgentProcessManager — their stdout/stderr is captured automatically and shown in the Agent Debug Panel. Self-executed remote agents run in your own terminal, so their logs appear there instead.
Agent Debug Panel
Open the Agent Debug Panel from the sidebar in the Codebolt application. It has two panes:
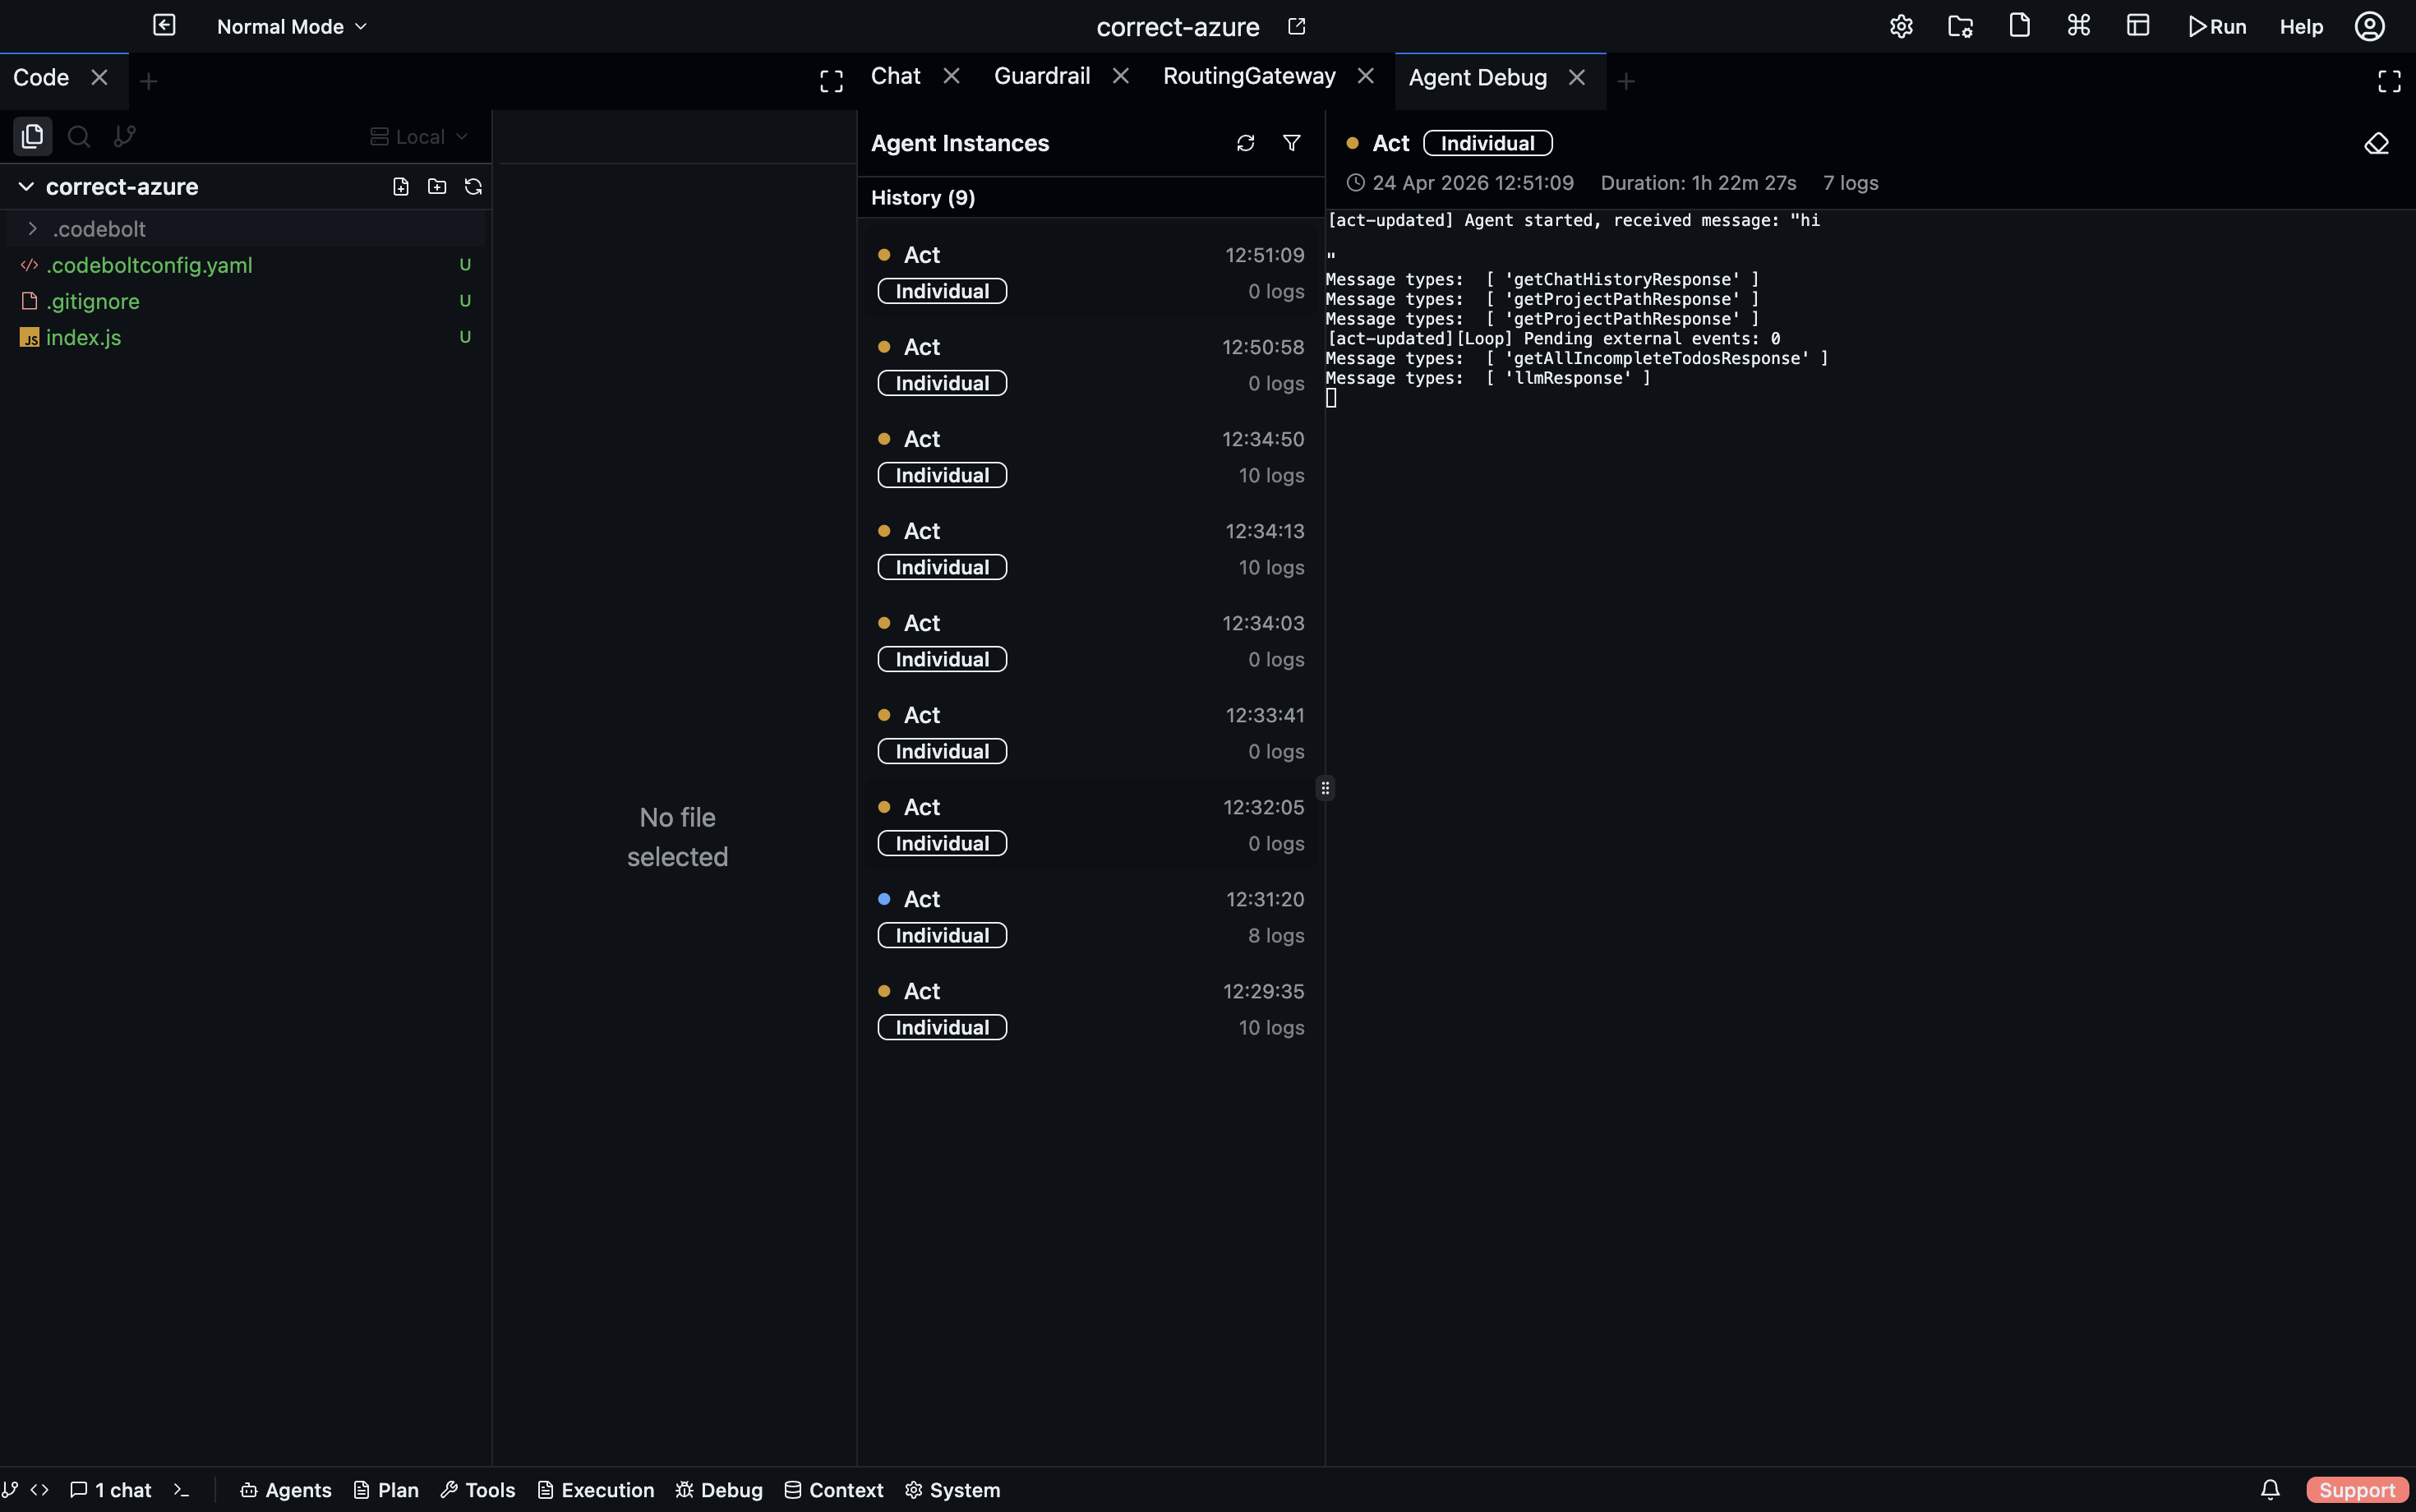
- Left pane — instance list, grouped by Running and History. Shows agent name, type badge, start time, and log count.
- Right pane — terminal-style log viewer for the selected instance, with real-time streaming.
What you see for each instance
| Field | Description |
|---|---|
| Agent name | The agent's display name from codeboltagent.yaml |
| Type | individual, child, subagent, swarm, or orchestrator |
| Status | running, completed, failed, or cancelled |
| Duration | How long the session ran |
| Log count | Total stdout + stderr messages captured |
| Child agents | Sub-agents spawned by this agent (shown nested) |
Filtering
Filter the instance list by:
- Status — running, completed, failed
- Agent type — individual, child, subagent, swarm, orchestrator
- Thread — filter by conversation thread
- Swarm — filter by swarm group
How agent logs work
Storage
All debug data is stored in your project at .codebolt/agentdebug/:
.codebolt/agentdebug/
├── index.json                          # Index of all debug sessions
├── {instanceId}.meta.json              # Metadata for each session
└── {instanceId}.log                    # NDJSON log file (one JSON entry per line)
Log entries are stored as NDJSON:
{"ts": "2025-01-15T10:30:00.000Z", "type": "stdout", "msg": "Agent processing message..."}
{"ts": "2025-01-15T10:30:01.000Z", "type": "stderr", "msg": "Warning: token limit approaching"}
Real-time streaming
Logs stream to the UI via WebSocket at /agent-debug. When you select an instance in the panel, you see:
- Historical logs loaded from the NDJSON file (with pagination)
- New logs appended in real-time as the agent runs
Session lifecycle
- Session starts when
AgentProcessManagerspawns an agent process. A meta file and empty log file are created. - Logs stream as the agent writes to stdout/stderr. Each line is persisted to the NDJSON file and broadcast to connected UI clients.
- Session ends when the process exits. Status is set to
completed(exit code 0) orfailed(non-zero). Duration is calculated. - Stale cleanup — if the app crashes while agents are running, those sessions are marked
cancelledon next startup.
REST API
Access debug data programmatically:
| Endpoint | Method | Description |
|---|---|---|
/agent-debug/instances | GET | All debug sessions |
/agent-debug/instances/filtered?status=running | GET | Filter by status, agentType, threadId, swarmId |
/agent-debug/running | GET | Currently running sessions |
/agent-debug/by-thread/:threadId | GET | Sessions for a thread (includes child agents) |
/agent-debug/instances/:id | GET | Single session metadata + child agents |
/agent-debug/instances/:id/logs?offset=0&limit=500 | GET | Paginated logs |
/agent-debug/instances/:id/raw-logs | GET | Raw NDJSON entries |
/agent-debug/cleanup?daysOld=30 | DELETE | Remove old debug data |
Debugging custom agents
Level 1 (framework) agents
Use console.log / console.error in your agent code. Everything written to stdout/stderr is captured by the debug system:
codebolt.onMessage(async (reqMessage) => {
  console.log('[my-agent] Received message:', reqMessage.userMessage?.substring(0, 100));

  const agent = new CodeboltAgent({
    instructions: systemPrompt,
    enableLogging: true,  // Framework logs internal events
  });

  const result = await agent.processMessage(reqMessage);
  console.log('[my-agent] Result:', result.success ? 'success' : result.error);
});
enableLogging: true (the default) makes CodeboltAgent log internal events like compaction, tool refresh, and errors to the console — all captured in the debug panel.
Level 2 (codeboltjs) agents
Same approach — console.log and console.error are captured. Use stderr for warnings and errors so they appear as a different type in the log viewer.
Third-party agents
Third-party agent wrappers capture the vendor CLI's stdout/stderr. All output from Claude Code, Codex, Gemini, etc. appears in the debug panel.
Self-executed remote agents
Self-executed remote agents are not spawned by Codebolt — you start them yourself in your own terminal. Because of this, their stdout/stderr goes to your terminal, not to the Agent Debug Panel.
When you create a self-executed remote agent, Codebolt shows you the environment variables to set before running:
# On macOS/Linux
export threadToken=<token>
export agentId=<agent-id>

# On Windows
set threadToken=<token>
set agentId=<agent-id>
Set these in your terminal, then start your agent process. All logs will appear in that terminal. The agent communicates with Codebolt via WebSocket using the thread token, but the debug output stays local to your terminal.
For agents started by Codebolt (including codeboltExecuted remote agents), logs go to the Agent Debug Panel as usual.
Common failure patterns
"Agent keeps calling the same tool in a loop"
Look at the log output for repeated tool calls with the same arguments.
- Add
LoopDetectionServiceto your agent config. - Check if the tool is returning a confusing result the agent misinterprets as "try again".
- Add a system prompt instruction: "if a tool returns an error, do not retry the same call."
"Agent ignores a user instruction"
The instruction may have been compressed away or buried under too much context.
- Check if
ChatCompressionModifieris active — it may have summarized away the instruction. - Pin important instructions with
@-mentions to force them into context. - Reduce the amount of context being assembled.
"Agent runs for a long time doing nothing"
Check the debug panel for the last log entry.
- Tool call hanging — a tool is taking too long to respond.
- Slow LLM — the provider is slow; check provider health.
- Long context assembly — large projects take longer for directory and environment context.
"Agent makes the wrong tool call"
Usually a problem with the tool descriptions the LLM sees.
- Check if the right tool is in the
allowedToolslist. - Override tool descriptions with more explicit instructions.
- Too many similar tools confuse the LLM — tighten the allowlist.
"Agent is too expensive"
Usually caused by too much context being assembled.
- Add
ConversationCompactorModifierto compress the transcript between turns. - Reduce
maxTurnsto prevent runaway loops. - Use
ChatCompressionModifierto summarize older history.
The debug mindset
- Check the debug panel first. The logs are ground truth — don't guess.
- Find the first thing that went wrong. Not the last error, but the first odd decision.
- Check what the LLM actually saw. With
enableLogging: true, the framework logs the prompt assembly steps. - Use filters. Filter by thread or agent type to focus on the relevant sessions.
- Check child agents. If a parent agent delegated to sub-agents, check their logs too — the debug panel shows the hierarchy.
Log entry types
Each entry in the Agent Debug panel's log stream is one of:
| Type | What it shows |
|---|---|
| LLM Request | Full prompt sent — system prompt, all messages, model name, token count. Expand to read the full context window. |
| LLM Response | Raw model reply streamed token-by-token, including structured tool call JSON |
| Tool Call | Tool name, input parameters, result (collapsed), and duration |
| Status Event | Phase transitions (thinking, executing, reflecting, completed) with phase duration |
| Error | Exception with full stack trace |
Filtering
Use the filter bar to narrow the stream:
| Filter | Shows |
|---|---|
| All | Everything |
| LLM | Only LLM requests and responses |
| Tools | Only tool calls and results |
| Errors | Only error entries |
| Status | Only phase transitions |
Live vs history mode
Agent Debug defaults to Live — shows the current run as it happens. Click History and select a previous thread to replay its full debug log.
Copying debug data
Right-click any log entry → Copy as JSON to export the raw event. Useful for bug reports, token-usage analysis, or sharing a specific LLM call.
Narrative Graph
The Narrative Graph (Code Observability → Narrative Graph) visualises an agent run as a directed graph — user message → LLM decisions → tool calls → completion — so you can see the branching and retry structure at a glance rather than scanning a flat log. See Narrative Graph for full details.